December 31, 2017
December 08, 2017
Day #93 - Regularizations
Four methods of Regularization
- Cross Validation inside training data
- 4 to 5 folds of K-Fold Validations
- Split into K non-intersecting subsets
- Leave one out scheme
- Target variable leakage is still present in K Fold Scheme
- Smoothing based on size of category
- Category big lot of data points
- Formula = (mean(target)*nrows+globalmean*alpha)/(nrows+alpha)
- alpha = category size we can trust
- Add Random Noise
- Unstable, Hard to make it work
- Too much noise
- LOO, Leave one out Regularization
- Sorting and calculating mean on some type of data
- Fix sorting order of data
- Use Rows 0 to N-1 to calculate mean for N-1
- Least Leakage
November 28, 2017
Day #92 - Mean Encoding
Mean Coding
Weight of Evidence = In(Goods/Bads)*100
Count = Goods = sum(target)
Diff = Goods-Bads
- Add new variables based on certain features
- Label encoding is done usually
- Mean encoding is done as variable count / distinct unique variables
- The proportion of label encoding also is included in this step
- Min encoding with label encoding
- Label encoding - No logical order
- Mean encoding - Classes are separable
- We can reach better loss with sorted trees
- Trees need huge number of splits
- Model tries to treat all categories differently
- Goods - Number of ones in a group
- Bads - Number of zeros
Weight of Evidence = In(Goods/Bads)*100
Count = Goods = sum(target)
Diff = Goods-Bads
Happy Learning!!!
November 24, 2017
Database Sharding and Scalability Basics
Some Key considerations for NOSQL Vs RDBMS
Great Session Talk
RDBMS VS NOSQL Considerations, Quick Summary
- Performance - Latency tolerance, How slow my queries can run for huge data sets
- Durability - Data loss tolerance when database crashes losing in-memory or Lost transactions tolerance
- Consistency - Weird results tolerance (Dirty data tolerance)
- Availability - Downtime tolerance
- Replication - Create copies of database, Application can talk to either database
- Sharding - Sharding choosing a partition key, Key-value store partition based on key
- Caching - Precomputed and stored, Manage cache expiration time and refresh logic
Great Session Talk
RDBMS VS NOSQL Considerations, Quick Summary
- Performance - Latency tolerance
- Durability - Data loss tolerance
- Consistency - Weird results tolerance (Dirty data tolerance)
- Availability - Downtime tolerance
November 16, 2017
Day #91- Retail Analytics - Data Mining / Analytics
Running a successful #Retail Store has a lot of Data Mining / Analytics challenges to solve and arrive at decisions based on data. Some of interesting Retail Data Mining / Analytics problems are
- What sells best in each store with item level details
- What are shopping time/routine for particular store
- Using web data identify the relevance of shopping district / retail environment
- What are money making items in the store (Quantity vs Price)
- What is Sales / Stock ratio?
- What is the forecast value of minimum orders for items in each store based on sales/traffic trends?
- What is the correlation between Loss items, Shopping days/periods / people movements?
- What is the retail price points identified based on End of Season Sales ?Forecasts / Predictions come as next steps after Data Analysis
November 15, 2017
Day #90 - Regression Metrics Optimization
RMSE, MSE, R-Squared (Sometimes called L2 Loss)
Tree-Based
Tree-Based
Tree-Based
- XGBoost, LightGBM
- sklearn.RandomForestRegressor
- sklearn.<>Regression
- sklearn.SGDRegressor
- PyTorch
- Keras
Tree-Based
- LightGBM
- sklearn.RandomForestRegressor
- MSPE is weighted version of MSE
- MAPE is weighted version of MAE
November 14, 2017
Day #89 - Capsule networks
Key lessons
Convolutional Network Challenges
Happy coding and learning!!!
- Instead of adding layers it nests layers inside it
- We apply non-linearity to grouped neuros (capsule)
- Dynamic routing - Replace scalar output feature detector of CNN by routing by agreement based on output
- Latest paper on capsule networks
- Offers state of art performance for MNIST dataset
- Convolutional networks - Learn mapping for input data and output label
- Convolution layer - Series of matrix multiplication and summation operation, Output feature map (bunch of learned features from image)
- RELU - Apply non-linearity to it (Network can learn both linear and non-linear functions). Solves vanishing gradient problem. (As gradeient is backpropagating its getting smaller and smaller, RELU prevents it)
- Pooling - Creates sections and take maximum pixel value from each sections
- Each line of code corresponds to layers in networks
- Dropout - Neurons randomly turned on to prevent overfits (Regularization technique)
- For handling rotations - AlexNet added different rotations to generalize to different rotations
- Deeper networks improved classification accuracy
- VGGnet adding more layers
- Googlenet - Convolution with different sizes processed on same input, Several of those together
- Resnet - Instead of stacking layers, Add operation improved vanishing gradient problem
Convolutional Network Challenges
- As we go up the hierarchy each of features learnt will be more complex
- Hierarchy happening with each layers
- Sub-sampling loses spatial relationships
- Spatial correlations are missed in sub-sampling and pooling
- Bad for rotated images (Invariance issues)
- Basic idea - Human brain attains transnational invariance in a better way, Instead of adding layers it nests layers inside it
- Nested layer is called capsule, group of neurons
- CNN route by pooling
- Deeper in terms of nesting
- Based on output neuron we apply non-linearity
- We apply non-linearity to grouped neuros (capsure)
- Replace scalar output by routing by agreement
- Hierarchy tree of nested layers
Happy coding and learning!!!
Day #88 - Metrics Optimization
Loss vs Metric
Accuracy Metrics


Happy Coding and Learning!!!
- Metric - Function which we want to use to evaluate the model. Maximum accuracy in classification
- Optimization Loss - Easy to optimize for given model, Function our model optimizes. MSE, LogLoss
- Preprocess train and optimize another metric - MSPE, MAPE, RMSLE
- Optimize another metric postprocess predictions - Accuracy, Kapps
- Early Stopping - Stop traning when models starts to overfit
Accuracy Metrics


Happy Coding and Learning!!!
November 10, 2017
Day #87 - Classification Metrics
- Accuracy (Essential for classification), Weighted Accuracy = Weighted Kappa
- Logarithmic Loss (Depends on soft predictions probabilities)
- Area under Receiver Operating Curve (Considers ordering of objects, tries all threshold to convert soft predictions to hard labels)
- Kappa (Similar to R Squared)
N - Number of objects
L - Number of classes
y - Ground truth
yi - Predictions
[a = b] - indicator function
- Soft labels (soft predictions) are classifier's scores - Probabilities of objects
- Hard Labels (hard predictions) - argmax fi(x), [f(x)>b], b - threshold for binary classification, Predict label, maximum value from soft prediction and set class for prediction label. Function of soft label
- Most referred measure of classifier quality
- Higher is better
- Need hard predictions
- Number of correctly guessed objects
- Argmax of soft predictions
- Work with soft predictions
- Make classifier output posterior probabilities
- Penalises for wrong answers
- Set constant to frequencies of each class
- Based on threshold decide percentage of above / below the threshold
- Metric tries all possible ones and aggregate scores
- Depends on order of objects
- Compute TruePositive, FalsePositive
- AUC max value 1
- Fraction of correctly ordered pairs
= 1 - (Fraction of incorrectly ordered pairs / total number of pairs)
Cohen's Kappa
- Score = 1- ((1-accuracy)/(1-baseline))
- Baselines different for each data
- Similar to R squared
- Here R predictions for dataset used as baseline
- Error = (1- Accuracy)
- Weighted Error Score = Confusion matrix * Weight matrix and sum their results
- Weighted Kappa = 1 - ((weighted error)/(weighted baseline error))
- Useful for medical applications


November 09, 2017
Day #86 - Regression Metrics
- Relative Errors most important to us
- MSW, MAE work with absolute error not for relative errors
- MSPE (mean square percentage error)
- MAPE (mean absolute percentage error) - Weighted version of MAE
- RMSLE (Root mean square lograthmic error) - RMSE calculated in lograthmic scale - Cares about relative errors
November 07, 2017
Day #85 - Regression Metrics Optimization
Metrics
N - Samples
y - target values
y~ - target Predictions
yi - target ith value
yi~ - prediction ith object
Mean Square Error
MSE = 1/N(yi - yi~)^2
- Average the squared differences between actuals and targets
RMSE - Root Mean square Error = Sqrt(MSE)
- Metrics used to evaluate submissions
- Best result finding optimal hyperplane
- Exploratory metric analysis along with data analysis
- Own ways to measure effectiveness of algorithms
- Mean Aquare Error
- RMSE
- R Squared
- Same from optimization perspective
- Accuracy
- LogLoss
- AUC
- Cohen's Kappa
N - Samples
y - target values
y~ - target Predictions
yi - target ith value
yi~ - prediction ith object
Mean Square Error
MSE = 1/N(yi - yi~)^2
- Average the squared differences between actuals and targets
RMSE - Root Mean square Error = Sqrt(MSE)
- Same as scale of target
- RMSE vs MSE
- Similar in terms of minimizers
- Every RMSE minimizer is MSE minimizer
- MSE(a) > MSE(b) <=> RMSE(a) > RMSE(b)
- MSE orders in same way as RMSE
- MSE easier to work with
- Bit of difference in gradient based model
- They may not be interchargeable for learning methods (learning rate)
- How much model is better than constant baseline
- 1 predictions perfect
- WHEN MSE is 0, R Square = 1
- All reasonable models score between 0 and 1
- Avg of absolute difference value between target and predictions
- Widely used in Finance
- 10$ Error twice worse than 5$ Error
- MAE easier to justify
- Median of target values useful for MAE
- MAE gradient step function -1 smaller than target, +1 when greater than target
- MAE is not differentiable
- For outliers - use MAS
- unexpected but normal MSE
- MAE robust to outliers
November 05, 2017
Day #84 - Data Leaks and Validations
- Mimic Train / Test Splot as the test data
- Perform KFold Validations
- Choose best parameters for models
- Submission Stage (Can't mimic exact train / test split)
- Calculate mean and standard deviations of leader board scores
- Unexpected information in data that lets you make good predictions
- Unusable in real world
- Results of unintentional error
- Incorrect timesplits still exists
- Check public and private splits
- Missing feature columns are data leaks
- Use File creation dates
- Resize features / change creation date
- ID's no sense to include in model
October 31, 2017
Day #83 - Data Splitting Strategies
- Time based splits
- Validation to mimic train / test pic
- Time based trend - differs significantly, Time based patterns important
- In generated features
- In a way model will rely on that features
- In Some kind of target leak
- Random Split (Split randomly by rows, Rows independent of each other), Row wise
- Device special features for dependency cases
- Timewise - Before particular date as training, After date as testing data. Useful features based on target
- Moving window validation
- By Id - (By Clustering pictures, grouping them and then finding features)
- Combined (Split date for each shop independently)
- In most cases split by Rownumber, Time, Id
- Logic for feature generation depends on data splitting strategy
- Set up your validation to mimic the train / test split of competition
Day #82 - Validation and Overfitting
- Train Data (Past), Unseen Test Data (Future)
- Divide into three parts - Train (Past), Validation (Past), Test (Future)
- Underfitting (High Error on Both Training and Validation)
- Overfitting (Doesn't generalize to test data, Low Error on Train, High Error on Validation)
- Ideas (Lowest Error on both Training and Testing Data)
- Hold Out (divide data into training / testing, No overlap between training / testing data ) - Used on Shuffle Data
- K-Fold (Repeated hold out because we split our data) - Good Choice for medium amount of data, K- 1 training, one subset - Used on Shuffle Data
- Leave one out : ngroups = len(train) - Too Little data (Special case of K fold, K = number of samples)
- Stratification - Similar target distribution over different folds
- Small datasets (Do Random Splits)
- Unbalanced datasets
- Multiclass classification
Happy Coding and Learning!!!
October 30, 2017
Day #81 - Dataset Cleaning
Dataset cleaning
- Constant features (Remove constants features who value remain constant in both training and testing data, Value is constant in training but changes in testing - better to remove those features, Only fraction of features supplied in data, Same value in both training and testing set)
- Duplicated features (Completely identical columns, This will slow down training time, remove duplicate columns)
- Duplicated categorical features (Encode categorical features and compare them)
- Duplicated rows (Duplicated rows with different targets, could be result of mistake, remove those duplicated rows to have high score on test set)
- Check for common rows in train and test sets (Set labels manually for test rows in training set)
- Check if dataset is shuffled (Oscillations around mean would be observed)
- Get Domain Knowledge
- Check How data is generated
- Explore individual feature
- Explore pairs and groups
- Clean features
October 29, 2017
Day #80 - Visualizations
EDA is an art. Visualizations are art tools. Several different plots to prove hypothesis
Visualization Tools

Visualization Tools
- Histograms (Split into bins, how many points fall in each bins, vary number of bins) - plt.hist(x)
- XGBoost will benefit from explicit missing values
- Plots - index versus value, plt.plot(x,'.'), randomness over indices
- Statistics
- Scatter Plots (Draw one features vs other), Data distribution between train and test tests validate how they are distributed
- Correlation Plots (Run K-means clustering and reorder feature) - How similar features are
- Plot (index vs feature statistics)
- Generate new features based on groups
- ScatterPlot, Scatter matrix
- Correlation Plot (Corrplot)
- Corrplot + Clustering
- Plot (Index vs feature statistics)
More Read (Link)
Happy Learning and Coding!!!
Day #79 - Exploratory Data Analysis (EDA)
EDA
Anonymized Data
- Looking data, Understanding data
- Complete data understanding required to build accurate models
- Generate Hypothesis / Apply Intuition
- Top solutions use Advanced and Aggressive Modelling
- Find insights and magic feature, Start with EDA before hardcore modeling
- Identify Patterns (Visualization to idea)
- Use patterns to find better models (Idea to visualization, Hypothesis testing)
- Domain Knowledge (Google, Wikipedia understand data)
- Check data is Intuitive (Values in data validate based on acquired domain knowledge, Manual correction of error, Mark incorrect rows and label them for model to leverage it)
- Understand how data is generated (Test set / Training set generated by the Same Algorithm ? / Need to know underlying data generation Process / Visualize Training / Test set plots)
Anonymized Data
- Replace data with encrypted text (This will not impact model though)
- No meaningful names of columns
- Find unique values of features, sort them and find differences
- Distance between two consecutive features and the pattern for it
- Guess the meaning of the columns
- Guess the types of the column (Categorical, Boolean, Numeric etc..)
- Find relation between pairs
- Find feature groups
- df.dtypes
- df.info()
- x.value_counts()
- x.isnull()
Happy Learning and Coding!!!
Day #78 - Image Processing - Kaggle Lessons
- Use Trained model on data similar
- Train network from scratch
- Using pretrained model and Fine tune later
- Remove Last layer with new one size of 4
- Retrain model
- Benefit from model trained from similar dataset
- Increase number of training samples
- Image rotations
Day #77 - Quick Summary - Kaggle Lessons - Features, Dates, Text
- For Features - One Hot Encoding, Label Encoding, Frequency Encoding, Ranking, MinMaxScaler, StandardScaler
- For Dates - Periodicity - Year, Date, Week, Time Slice - Time past since particular moment (before / after), Difference in Dates (Datetime_feature1 - Datetime_feature2), Boolean binary indicating date is holiday or not
- For Text - Preprocessing - Lowercase, Stemming, Lemmatization, stopwords removal, Ngrams can help use local context, Postprocessing - TFiDF, Use BOW for Ngrams
Day #76 - Text Processing - Kaggle Lessons
Bag of Words
- Create new column for each unique word in data
- Count occurrences in each documents
- sklearn.feature_extraction.text.CountVectorizer
- More comparable by using Term Frequency
- tf = 1 / x.sum(axis=1)[:,None]
- x = x*tf
- Inverse Document Frequency
- idf = np.log(x.shape[0])/(x>0).sum(0)
- N Grams
- Bag of Words (Each row represents text, Each column represents unique word)
- Classifying document
For N = 1, This is a sentence
Unigrams are - This, is, a , sentence
For N = 2, This is a sentence
bigrams are - This is, is a, a sentence
For N = 3, This is a sentence
Trigrams are - This is a, is a sentence
sklearn.feature_extraction.text.CountVectorizer: Ngram_range, analyzer
Text Preprocessing steps
- Lower case
- Lemmatization (using knowledge of vocabulary and morphological analysis of words)
- democracy, democratic and democratization -> democracy (Lemmatization)
- Stemming (Chops of ending of words)
- democracy, democratic, and democratization - democr (Stemming)
- Stop words (Not contain important information)
I have done all this in my assignment work. This is there in my github code
For Applying Bag of words
- Preprocessing - Lowercase, Stemming, Lemmatization, stopwords removal
- Ngrams can help use local context
- Postprocessing - TFiDF
- Use BOW for Ngrams
- Sentence - The dog is on the table
- Representation - are, cat, dog, is, now, on, the, table
- BOW representation - 0, 0, 1, 1, 0, 1, 1, 1
BOW Issue
The food was good, not bad at all
The food was bad, not good at all
Both representations are the same however the meaning varies :)
- Get vector representation of words and texts
- Each word converted to vector
- Uses nearby words
- Different words used in same context will be used in vector representation
- Apply basic operations can be done on vectors
- Words - Word2Vec, Glove, FastText
- Sentences - Doc2Vec
- There are pretrained models
- Very large vectors
- Meaning of each value in vector is unknown
- Relatively small vectors
- Values of vector can be interpreted only in some cases
- The words with similar meaning often have similar embeddings
October 27, 2017
Day #75 - Missing Values
- Reasons for Missing Values
- How to Engineer them effectively
- Hidden Missing Values
- Plot distribution of values and find from histogram
- -999, -1 (Fill with some value) - useful to provide different category, Perf Suffers
- mean, median
- Reconstruct value
- add isnull column
- Missing values in timeseries
- Temperature values missing for some days of month
- Based on increase / decrease pattern
- Ignore missing value while calculating mean
- Change Categories to frequencies
- XGBoost can handle NAN
Day #74 - Feature Generation - DateTime and Coordinates
DateTime
- Differ Significantly between numeric and categorial features
- Periodicity - Year, Date, Week
- Time Slice - Time past since particular moment (before / after), Time moments in period
- Difference in Dates (Datetime_feature1 - Datetime_feature2)
- Special Time period (Medication every 3 days)
- Sales Predictions (Days since last holiday, Days since weekend, Since last sales campaign)
- Boolean binary indicating date is holiday or not
- Sales Context Churn Prediction
- (Date Since user registration) - DateDiff
- (Date Since last purchase) - DateDiff
- (Date Since calling customer service) - DateDiff
- Periodicity - Day number in week, month, season, year, second, minute, hour
- Time Slice, Difference between dates
- This can be used for churn prediction (Likelihood customer will return)
- In Real Estate Scenario for predictions on Prices
- (Distance from School)
- (Distance from Airport)
- (Flats around particular point)
- Alternatively distance from maximum expensive flat
- Centre of clusters and find distances from centre point
- Aggregated Statistics for surrounding data
Day #73 - Feature Generation - Categorical and ordinal features
- Label Encoding - Based on Sort Order, Order of Appearance
- Frequency Encoding - Based on Percentage of occurence
- Sex, Cabin, Embarked
- One Hot Encoding
- pandas.get_dummies
- sklearn.preprocessing.OneHotEncoder
- Works well for Linear methods (Minimum is zero, Maximum is 1)
- Difficult for Tree methods based on One Hot Encoding Approach
- Store only Non-Zero Elements (Sparse Matrices)
- Create combination of features and get better results
- Concatenate strings from both columns
- One hot encoding it, Find optimal coefficient for every interaction
3,male,3male
1,female,1female
3,female,3female
1,female,1female
pclass_sex ==
1male,1female,2male,2female,3male,3female
0,0,0,0,1,0
0,1,0,0,0,0
0,0,0,0,0,1
0,1,0,0,0,0
Ordinal Features
- Ordered categorial feature
- First class expensive, second less, third least expensive
- Drivers License Type A,B,C,D
- Level of Education (Sorted in increasingly complex order)
- Label Encoding, Map to numbers (Tree based)
- Non Tree can't use effectively
1. Alphabetical sorted [S,C,D] -> [2,1,3]
- sklearn.preprocessing.LabelEncoder
2. Order of Appearance
[S,C,Q] -> [1,2,3]
- Pandas.Factorize
Frequency Encoding (Depending on Percentage of Occurences)
[S,C,Q] -> [0.5,0.3,0.2]
encoding -> titanic.groupby('Embarked').size()
encoding = encoding/len(titanic)
titanic['enc'] = titanic.Embarked.map(encoding)
Frequency encoding will help for Linear based models (If frequency is correlated with target value then linear model will use the dependency). Preserve value distribution.
- Equal Distributiona apply rank ties
- from scipy.stats import rankdata
- Ordinal is special case of categorial feature
- Label Encoding maps categories to numbers
- Frequency encoding maps categories to frequencies
- Label and frequency encoding are used for Tree based models
- One-Hot encoding is used for non-tree based models
- Interactions of categorial features can help linear models and KNN
Day #72- Feature Generation - Numeric Features
Feature Generation
Preprocessing Outliers
- Predict Apple Sales (Linear Trend)
- Examples - Add features indicating week number, GBDT will consider min calculated value for each week
- Created Generated Tree
- Tree based Methods (Decision Tree)
- Non Tree based Methods (NN, Linear Model, KNN)
- Apply Regularization in equal amounts
- Do proper scaling
- To [0,1]
- sklearn.preprocessing.MinMaxScaler
- X = (X-X.min())/(X.max()-X.min())
- To mean = 0, std = 1
- sklearn.preprocessing.StandardScaler
- X = (X-X.mean())/X.std()
Preprocessing Outliers
- Calculate lower and upper bound values
- Rank transformation
- Better option than Min-Max Scale
- scipy.stats.rankdata
- Log transformation - np.log(1+x)
- Raising to power < 1 - np.sqrt(x+2/3)
- Creating new features
- Engineer using prior knowledge and logic
- Example, Adding price per square feet if price and size of plot is provided
- Tree based methods don't depend on scaling
- Non-Tree methods hugely depend on scaling
- MinMaxScaler - to [0,1]
- StandardScaler - to mean==0, std==1
- Rank - sets spaces between sorted values to be equal
- np.log(1+x) and np.sqrt(1+x)
Day #71 - Kaggle Best Practices
After a long pause back to learning mode. This post is on learning's from Coursera course - Winning Kaggle Competitions (https://www.coursera.org/learn/competitive-data-science)
Session #1
Basics on Kaggle Competition
- Data - text, pictures (Format could be csv, database, text file, speech etc). Accompanied by description of features
- Model - Exactly built during competition. Transforms data into answers, Model propertiese - Product best possible prediction and be reproducible
- Submissions - Compare against models and predictions submitted
- Evaluations - How good is your model, Quality of model defined by Evaluation function (Rate of correct answers)
- Evaluation Criteria - Accuracy, Logistic Loss, AUC, RMSE, MAE
Guidelines for submissions
- Analyze data
- Fit model
- Submit
- See Public Score
- kaggle
- DrivenData
- CrowdAnalityx
- CodaLab
- DataScienceChallenge.net
- DataScience.net
- KDD
- VizDooM
Using Kaggle
- Data format and explanations
- Evaluation Criteria
- Sample Submission File
- Timelines page
Real - World Machine learning problems have Several Stages
- Understand business problem
- Problem Formulation
- Collect Data, Mine Examples
- Clean Data
- Preprocess it
- Identify Model for Task
- Select best models
- Accuracy
- Deploy model (make it available to users)
- Monitor and retrain with new data

Kaggle
- All data collected and problems fixed
- Model creation and evaluation
- Real world problems are complicated
- Competition are a great way to learn
- But Kaggle competitions don't address the questions of formalization, deployment and testing
- Importance of understaing data
- Tools to users
- Try (Complex solutions, Advance feature engineering, doing huge calculation)
- Linear Model (Classifying two set of points using linear lines, 2Dimesions) - Logistics Regression, SVM (Linear models with different loss functions), Good for Sparse High Dimesional data, Linear models into two subspaces
- Tree based - Use decision tree as basic block to build more complicated models (Tree based Decision Tree, Random Forest, Gradient Boosted Decision Trees), DT - Divide and Conquer approach to Recursively split spaces into sub spaces. Tree based methods split spaces into boxes
- KNN - Nearest Neighbours, Labels for points shown, Points close to each other are likely to have similar labels, K nearest objects and label with majority votes, Relies heavily on measure points
- Neural Networks - Special class of ML models, Blackbox produces most seperating curves, Play with parameters of simple feed forward networks. Good for image, sounds, text, speech
- Preprocess for feature engineering
- Basic feature generation for different types of features
- Numeric, Categorical, DateTime based features
- (0/1) - Binary Features
- Numeric features (Age, fare)
- Categorical (Classes)
- Each feature has own ways to be preprocessed
- Depends on model to use
- Linear models not for two class features
- One hot encoder
- Random forest can easily put each class seperately and predict each probability
Data Types
Structured Data
- Ordinal - Ranks 1st / 2nd / 3rd Ordinal Data
- Numerical - Specific Numeric Data
- Continuous - Petrol Prices continuous data
- Categorical - Days of Week, Months of Year

September 25, 2017

September 01, 2017
Exploring Analytics in Microsoft Azure
I am working on Microsoft Azure platform on a BI cloud solution. Some of the key components I worked recently are

Security aspects of this architecture is well handled with Firewall, IAM access as needed. This seems very stable even some of the components are constantly updated. This is high level architecture explanation, We will look into To-do exercises in coming weeks.
- Azure Data Factory
- Azure Data Lake
- Azure SQL Data warehouse
- Power BI on top of Data warehouse for reporting

The high level workflow for cloud based BI Solution and key components are
Step #1 - Moving Data from In premises to Cloud
Here data management gateway is installed on the in-premises machines, Pipelines are created in Azure Data factory to move data from In-premises to Azure Data lake
Step #2 - Azure Data Factory
ADF provides platform for data ingestion, Consuming high volumes of data. This experience setting up pipelines has some similarities and differences compared to SSIS. The key differences are
- Everything is JSON based
- Setting up Connections
- Defining input and output data formats in datsets
- Input and Output datasets also define the storage locations
- Defining Pipeline logic which includes, logic, input, output datasets, scheduling for pipeline
- This is bit straight forward but there is some learning with the tool, configuration properties
Step #3 - Azure Data lake
Azure Datalake is for storing data (RDBMS / No-RDBMS) data, If we have to integrate data from MSSQL, MYSQL for a realtime processing from two sources, We can leverage data lake to store and consolidate it later. The data stored in Datalake are referenced as external tables in AZURE Sql Datawarehouse
Step #4 - Web Application
All the references of data movement from Datalake and connectivity to Datawarehouse is managed by Access control leveraged with a Azure web app. The security aspect is well managed in Azure infrastructure
Step #5 - Data Consolidation into SQL Datawarehouse
The external tables referenced in Datalake can be referenced, queried in TSQL format and data loaded in Azure Datawarehouse tables. This is the location of fact and dimension tables that would power our datawarehouse. This could be done by stored procedures.
Step #6 - Power BI reporting
We have completed Data loading, data consolidation. The next is Power BI. PowerBI has the most power offering for web / mobile platforms. This is convenient and easy to use. The extended Analytics / R Support / Machine Library support also makes it suitable to run both Business Intelligence / Machine Learning solutions.
Security aspects of this architecture is well handled with Firewall, IAM access as needed. This seems very stable even some of the components are constantly updated. This is high level architecture explanation, We will look into To-do exercises in coming weeks.
Happy Learning!!!
July 19, 2017
Day #70 - Machine Learning - Deep Learning Fundamentals - Machine Learning Notes
Picture is worth 1000 words, Few examples listed in the book are very precise, clear on Machine Learning fundamentals. Below are few of the images on Machine learning / Deep Learning Concepts
Figure #1


Happy Learning!!!
Figure #1

- How machine learning, AL and Deep Learning are inter-related, The subset representation clearly represents the knowledge boundaries
- Deep Learning frameworks allow developers to iterate quickly, Making algos accessible to practitioners. Deep learning frameworks help to scale machine learning code for millions of users
- Its important to note fundamentals of Machine Learning is important to work with Deep Learning
Figure #2

- In Machine learning, historical data is used to derive learning's / rules from it and apply it for future data predictions
- From the data we need to identify (relevant features / variables), In this process we use different techniques like PCA, Correlation techniques, Derived features to identify relevant feature attributes for model creation
- From the vast amount of data we collect through enterprise applications / systems we need to identify / extract relevant data to build models and validate them. Setting up the data pipeline, training with required dataset becomes key for better / high accuracy models
Figure #3

- High level perspective of Deep Learning, How the nodes are defined, weights computed
- The loss part for each iteration is compared with predictions and sent back to perform weight updates, This iterations we call it as back propagation
- Deep Learning term is because the network are 'deep' - multiple hidden layers involved in computation
Figure #4

- SVM Wide street approach, line that separates two classes
- Allow non-linear decision boundaries
- Each dimension represents feature
- Goal of SVN - Train a model that assigns unseen objects into particular category
- Advantage - High Dimensionality, Memory Efficiency, Versatility
Machine Learning Notes


May 16, 2017
Day #69 - TSQL Skills for Data Pipeline and Cleanup Work
Pivot is a key thing when it comes to data preparation tasks, MSSQL pivot without aggregation does need a bit of workaround. Two things we will see in this post


Step 3 - Specify Save to Location, Data only option. After you specify options next step script runs and generates insert statement as needed.


Learning #1 - Script for Insert Data generation from MSSQL tables using SSMS (Hidden Gem in MSSQL)
Step 1 - Database -> Tasks -> Generate Scripts

Step 2 - Generate the Database objects (Tables as needed)


Learning #2- Pivot for Data Preparation scenario
For a given scenario of customer/orders, Pivoting the data for next level of tasks
Happy Learning!!!
May 14, 2017
Weekend Seminar - Deep learning in production at Facebook
Good Talk - Deep learning in production at Facebook https://lnkd.in/fX7BZif
Notes from Session
Deep Learning Use Cases
Notes from Session
Deep Learning Use Cases
- Event Prediction - Listing top relevant stories for the user, predicting relevance - Approach - Logistics regression + Deep Neural Networks
- Machine Translation - Automatically machine translated posts generated for users - Approach - Encoder - Decoder Architecture, Using RNN
- Natural Language Processing - Understand Context of text - Deep Text - Approach - CNN for words + RNN for sequences
- Computer Vision - Understand pics - Approach - CNN @ massive scale. Understand different aspects of pictures - Classification, Detection, Segmentation
- Computer faster - Tweaks in FFT, TiledFFT, Winograd to reduce convolution computations, NNPack, CuDNN for CPUs
- Memory Usage - GPU + Activations Memory released and reallocated during different layers of processing in Deep Networks
- Compress models - Exploit redundancy in model designs, prune them
Kaggle Vs Enterprise Machine Learning Adoption - Two sides of coin
Reposting Summary from Quora Answer with my perspective added
What you don't learn in Kaggle Competitions
- Determining business problem to solve with data
- Real world data imbalance, Accuracy issues, Maintaining Models
- Miss the challenges of data engineering (What features to select, causational vs correlation in domain context)
- Identifying / Reusing Existing data for first level models
- Identifying pipelines to build for more relevant variables
- ETL / Data Consolidation / Aggregation, Eliminating outliers / Redundant Data
Happy Learning!!!
April 29, 2017
Day #68 - CNN / RNN and Language Modelling Notes
At the end of every class, I have a feeling there is a lot to learn. People in the industry know things only at the application level. The depth of topics, mathematics discussed in class is very extensive. I always have a feeling of guilt "need to learn more". Every learning needs the breakpoint to correlate/understand end to end, to see the concept in a more familiar perspective. Always Keep Learning and Keep growing.
CNN Notes
Topics from Language Modelling class

CNN Notes
- In a CNN lower layers learn generic features like edges, shapes and feed it to higher layers
- Earlier layer - Generic features
- Later layer - Features specific to the corresponding problem
- For any related problems we can leverage existing network VGG16, VGG19, Alexnet and modify the higher layers based on our need
- Relu only passed those in Activation function where its > 0
- Vanishing gradient problem - Weights will stagnate over a period of time
- 6E/6W - Gradient Error with respect to weights
- 6E/6I - Gradient Error with respect to Image
- Main things is weights same across RNN
- Weights between successive layers same
- Document Classification, Data Generation, Chatbot, Time series - RNN can be used
Topics from Language Modelling class

Happy Learning!!!
April 28, 2017
Day #67 - Exploring Tableau Visualization
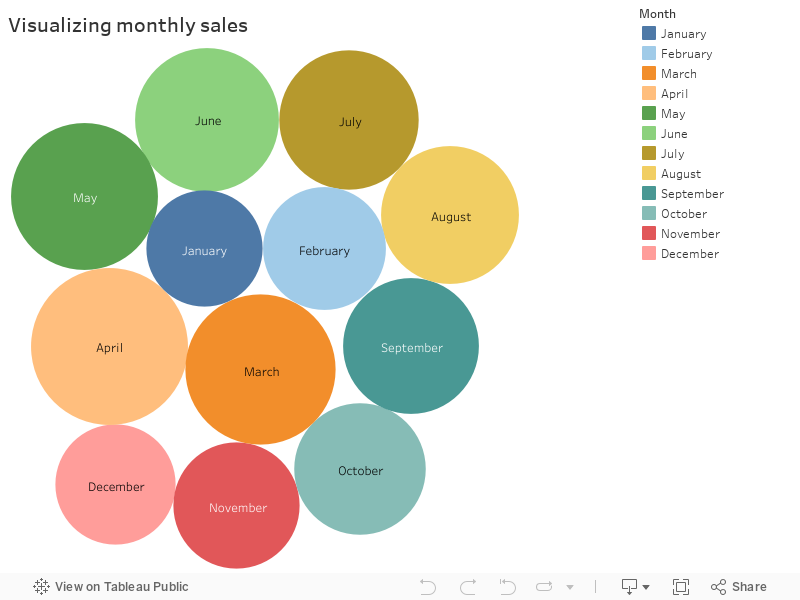
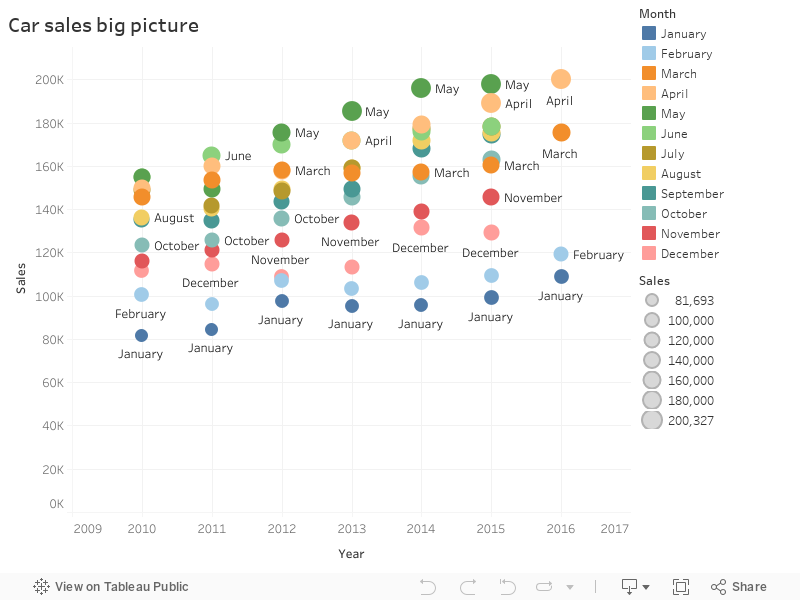
Canadian Car sales data visualization examples. The interpretation varies based on representation presented below. The data has all the details. Exploring same data in different visualization perspective will provide a different interpretation of same data.
Visualization #1 - This representation would help us figure out which month has usually high sales numbers
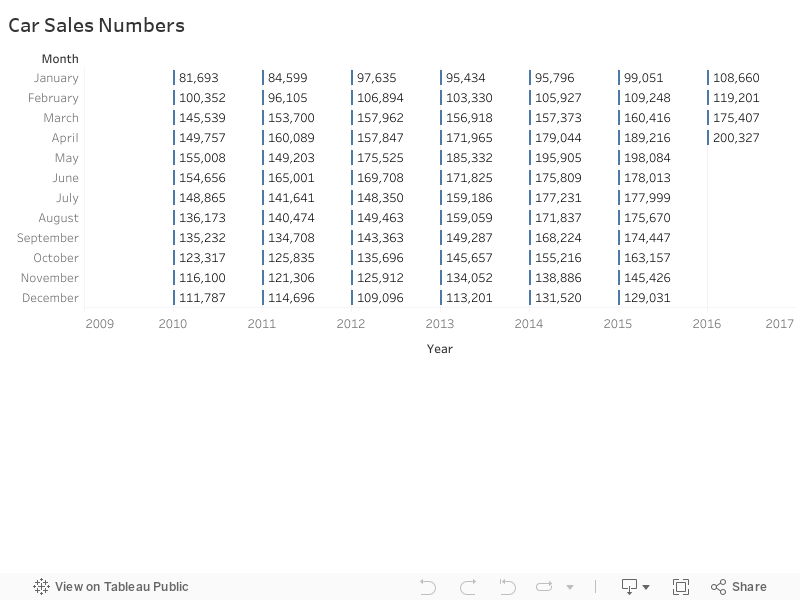
Visualization #3 - Data in simple table format
Visualization #1 - This representation would help us figure out which month has usually high sales numbers
- Three months of year (Dec-Jan-Feb) has relatively weak sales figures compared to rest of year
- March-August trend shows good demand from customers resulting in increased sales
- Last few months of the year shows decreased demand. This could be seasonal factor/holidays/travel. This need to be validated
- January is the lowest period of sales
- Sales trend is increasing YOY (year over year)
- May month consistently tops high sales for many years
Visualization #3 - Data in simple table format
- Six years total sales data is represented
- Partial data is available for the year 2016
April 27, 2017
Day #66 - Maths behind backpropagation
Today it's mathematical learning for neural network fundamentals.
- Derivation of Backpropagation
- Crash Course in Partial Differentiation
- A Step by Step Backpropagation Example
- In Neural Network, Network forward propagates activation to produce output and it back propagates error to determine weight changes
- Partial Derivative - Derivative of one of the variables holding the rest constant
- Backpropagation uses gradient descent method, one needs to calculate the derivative of squared error function with respect to the weights of the network.
April 26, 2017

April 23, 2017
Smart Farming
Product #1 - Automated Farming + Design Layout + Soil Monitoring + Solar powered = "Smart Farming"
Product #2 - Counting Fruits + Finding Weeds + Cattle monitoring
Happy Farming!!!
April 20, 2017
Data Science - Find your Winning use case
I observe a lot of technologies discussed in Data Science roles. It covers Big Data, Open Source, and Commercial Tools, R, Python, MapR, Spark, Azure, Various cloud providers etc...
"Identifying relevant domain/product related use case that helps improve business/numbers is the key"
This LinkedIn post provides a great clarity on focus on relevant use cases, small wins, and scale success.

"Identifying relevant domain/product related use case that helps improve business/numbers is the key"
This LinkedIn post provides a great clarity on focus on relevant use cases, small wins, and scale success.
Happy Analytics!!!
April 17, 2017
Day #65 - Python Package Installation commands - Windows
Had an issue running a code, Tried different options, Uninstalling existing version of keras and reinstalling it worked. Bookmarking commands
Happy Learning!!!
Happy Learning!!!
April 13, 2017
Day #64 - ETL for Data and Delta Data Management
Custom SSIS example sample for ETL setup for Data Extraction and Update
Scenario


SET ANSI_NULLS ON
GO
SET QUOTED_IDENTIFIER ON
GO
CREATE TABLE [dbo].[Table_1](
[Col1] [int] NULL,
[Col2] [int] NULL,
[Col3] [int] NULL
) ON [PRIMARY]
GO
Scenario
- Two Databases (Source and Target)
- Example with Test Table with few columns
- Ability to get New Data
- Ability get Delta Data (Updates)
Step in SSIS Project
Step 1 - Create a Data Flow Task
Step 2 - Add connection managers for Source and Target Databases

Step 3 - The operators and layout is (Source Data -> Lookup in Target Database -> Insert / Update TargetDatabase)

Step 4 - OLEDB Data Source Settings

Step 5 - Lookup to map for data

Step 6 - Lookup Mapping

Step 7 - Match Non-Matching for Insert / Updates


Step 8 - Match Destination Settings

Step 9 - Non Match Update Query

Step 10 - Non Match Update Params

Reference table script
SET ANSI_NULLS ON
GO
SET QUOTED_IDENTIFIER ON
GO
CREATE TABLE [dbo].[Table_1](
[Col1] [int] NULL,
[Col2] [int] NULL,
[Col3] [int] NULL
) ON [PRIMARY]
GO
Happy Learning!!!!
April 09, 2017
April 08, 2017
Day #63 - Notes from Text processing and Parallel Programming
Quick Summary notes for future reference
Text Processing - Word Sense Disambiguation
Memory Consistency
From Stackoverflow

Coarse Grained Vs Fine Grained
From Stackoverflow

Petersons Algorithm
More Reads - Link
Happy Learning!!!
Text Processing - Word Sense Disambiguation
- Rely on leveraging wordnet (Knowledge sources)
- from nltk.corpus import wordnet - leverage it
- Leverage Machine readable dictionary
- Sense bag (ambigious word)
- Context bag (different definitions to context word)
- Close match will be picked
- Use Thesaurus to find scores in context
- Highest score will be picked up for context relevance
- Thesaurus Library pywordnet, now part of NLTK
- Polysemy - many possible meanings for a word or phrase.
- Homonym - same spelling or pronunciation but different meanings
- Filter locks
- Bakery Algorithm
Memory Consistency
- Strict Consistency
- Sequentially consistent
- Relaxed(Weak) consistent
From Stackoverflow

Coarse Grained Vs Fine Grained
From Stackoverflow

Petersons Algorithm
More Reads - Link
Happy Learning!!!
April 07, 2017

April 06, 2017
April 02, 2017
Fundamentals Again - Day #61 - Hypothesis Testing
- Alternative Hypothesis - There is difference between groups
- Null Hypothesis - There is no difference between groups
- Binomial distribution - Two possible outputs
- Sampling distributions, Mode, Median, Mean, Variability in distribution (Standard Deviation), Chi Square Distribution
- Conduct T-Test, Check the P-value to know Significance
Happy Learning!!!
March 31, 2017
Day #60 - TSQL Profiling - Expressprofiler
Way better and Less complicated than SQL profiler

Link - Download
Jasper Report passing parameter between datasets
Happy Learning!!!
- Profiler by DB Name
- Profile by login account name

Link - Download
Jasper Report passing parameter between datasets
Happy Learning!!!
Day #59 - Image Object Classification using Keras
This post is for basic image classification in Keras using VGG19. We leverage pre-trained models to detect objects in the image
Happy Learning!!!
Happy Learning!!!
March 20, 2017
Day #58 - Hacker Earth Challenge
With Running projects, its bit challenging to manage multiple tasks. Bookmarking my thoughts until further analysis
Problem - Link
Data Analysis (Approach)
1. To eliminate class imbalance used smote technique
2. Used XGBoost to train and predict
3. Python 2.7 used. Two files one for Data cleanup, second for prediction
Happy Learning!!!
Problem - Link
Data Analysis (Approach)
- Load data in SQL Tables
- Analyze each column, Continous or Discrete variables
- Outliers, missing data, summary of each Data Column
- Manage Class Imbalances
- Convert the dataset into numeric columns
- Ignore any non-critical columns
- Identify Data Correlations if it exists (Pending task)
1. To eliminate class imbalance used smote technique
2. Used XGBoost to train and predict
3. Python 2.7 used. Two files one for Data cleanup, second for prediction
Happy Learning!!!
Day #57 - Xgboost on Windows 7, Python 2.7
On Python 2.7 Installed xgboost with below steps on Windows 7. This link was useful
1. Step 1 - Search for packages
anaconda search -t conda xgboost
2. Install Windows compatabile package
conda install -c mndrake xgboost
On Python3 Win64 Windows
conda install -c jjhelmus r-xgboost-cpu
conda install -c mikesilva xgboost
conda install -c rdonnelly py-xgboost
Happy Learning!!!
1. Step 1 - Search for packages
anaconda search -t conda xgboost
2. Install Windows compatabile package
conda install -c mndrake xgboost
On Python3 Win64 Windows
conda install -c jjhelmus r-xgboost-cpu
conda install -c mikesilva xgboost
conda install -c rdonnelly py-xgboost
Happy Learning!!!
March 15, 2017
error: Unable to find vcvarsall.bat
While 'im2col_cython', encountered thus error on Windows 7. There were several solutions provided but below option only worked for me.
building 'im2col_cython' extension
error: Unable to find vcvarsall.bat
This post was useful to fix it
Step 1 - Installed Microsoft Visual C++ Compiler for Python 2.7 from https://www.microsoft.com/en-in/download/details.aspx?id=44266
Step 2 - In Directory C:\Anaconda2\Lib\distutils, Modified msvc9compiler.py file as below
 Compiled as below
python.exe setup.py build_ext --inplace --compiler=msvc

building 'im2col_cython' extension
error: Unable to find vcvarsall.bat
This post was useful to fix it
Step 1 - Installed Microsoft Visual C++ Compiler for Python 2.7 from https://www.microsoft.com/en-in/download/details.aspx?id=44266
Step 2 - In Directory C:\Anaconda2\Lib\distutils, Modified msvc9compiler.py file as below

python.exe setup.py build_ext --inplace --compiler=msvc

Happy Learning!!!
Subscribe to:
Posts (Atom)


